Wesley Mission says Government is failing to act on gambling harm as pokies losses skyrocket even higher
Wesley Mission
Media Release 5 June 2025
NSW poker machine losses explode to $2.17 billion in first 90 days of 2025 – Wesley Mission says government is failing to act to address gambling harm
Wesley Mission is demanding the New South Wales government urgently act to protect people, as poker machine losses skyrocketed to $2.17 billion in the first 90 days of 2025. Some communities are now seeing average losses of more than $3,200 per person annually.
Wesley Mission CEO Rev Stu Cameron says it is “morally indefensible” that it appears industry continues to have a disproportionate influence on policy..
“The government is still bending to the will of powerful clubs and hotel groups while everyday people and families are being financially and emotionally crushed. This is the epitome of policy paralysis.”
The latest quarterly data compiled and analysed by Wesley Mission from Liquor and Gaming figures shows NSW residents are losing over $24 million every day — more than $1 million an hour — on poker machines.
For the first time, the data also includes estimated annual losses per person by Local Government Area. In:
• Fairfield: $3,255 per person
• Burwood-Strathfield: $2,511 per person
• Cumberland: $2,180 per person
These figures do not capture the full picture, as they include children and non-gamblers, meaning the real toll on regular gamblers is likely far higher.
Rev Cameron says what the Minns Government has done so far amounts to smoke and mirrors. “The industry is thriving, people are significantly harmed and the government keeps talking of ‘reform’ while the damage escalates. This inaction is a gift to the industry.”
An upcoming Performance Audit by the NSW Audit Office, due to be tabled in Parliament on June 12, is expected to confirm what frontline services already know: the current approach is failing.
Meanwhile, the number of poker machines keeps rising — with 87,789 electronic gaming machines now operating across the state.
Wesley Mission is calling on the NSW Government to immediately implement:
• Mandatory poker machine shutdowns from midnight to 10am
• A cashless gambling card with enforceable harm reduction limits
• Tighter caps on machine numbers in high-risk communities
“These are not radical ideas — they are basic public health protections,” said Rev Cameron.
“If people were being harmed this severely by alcohol, drugs, or unsafe roads, the government would act. Gambling should be no different. Instead, the government does little while the industry rakes in billions.”
Regional communities are also bleeding. In the first 90 days of the year:
• The Central Coast lost $83.9 million
• Newcastle lost $47.5 million
Wesley Mission continues to provide crisis support, housing assistance and financial counselling to those devastated by gambling harm across NSW.
ENDS
Wesley Mission CEO, Rev Stu Cameron is available for interview
Media contact: Anne Holt | [email protected] | 0418 628 342
Quarter 1 2025 poker machine loss data for NSW
Total Losses Q1: $2,169,617,069 (90 days in the quarter, 5.9% increase over Q1 2024)
Total losses Q1 2024: $2,048,132,057
Total Electronic Gaming Machines (EGMs) Q1: 87,789 (increase of 17 machines)
Daily losses Q1: $24,106,856
Hourly losses Q1: $1,004,452
[Note: losses in NSW are seasonal, and Q1 losses are always lower than Q4 of the previous year]
By venue type
|
Q1 2025 |
Net losses |
# EGMs |
# Premises |
% of losses |
|
Clubs |
$1,247,557,750 |
65,240 |
996 |
57.50% |
|
Hotels |
$922,059,319 |
22,549 |
1,147 |
42.50% |
|
Q1 2024 |
|
|||
|
Clubs |
$1,179,438,186 |
65,117 |
1,005 |
57.58% |
|
Hotels |
$868,693,872 |
22,495 |
1,168 |
42.42% |
Q1 Comparison 2019-2025
|
Q1 |
2019 |
2020[1] |
2021 |
2022 |
2023 |
2024 |
2025 |
|
Hotels |
$604,369,513 |
$579,110,616 |
$669,225,228 |
$776,084,548 |
$813,954,278 |
$868,693,872 |
$922,059,319 |
|
Clubs |
$969,467,135 |
$1,007,702,877 |
$1,031,323,574 |
$1,045,415,317 |
$1,133,908,753 |
$1,179,438,186 |
$1,247,557,750 |
|
Total |
$1,573,836,648 |
$1,586,813,493 |
$1,700,548,802 |
$1,821,499,865 |
$1,947,863,031 |
$2,048,132,058 |
$2,169,617,069 |
|
+/- previous yr |
|
+0.8% |
+7.2% |
+7.1% |
+6.9% |
+5.1% |
+5.9% |
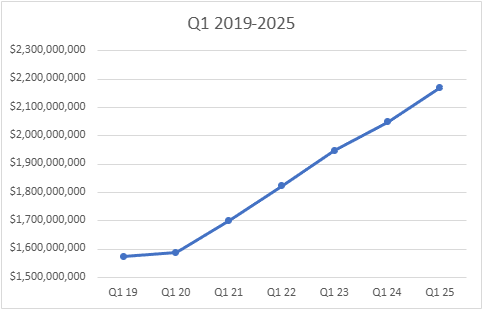
Figure 1: Losses Q1 annually, showing increases each year even during COVID lockdowns in 2020
1.1. Top grossing venues in Q1 2025
|
Venue |
Previous rank |
Suburb |
LGA |
Number of machines |
Estimated losses (profit to venue) for Q1 |
|
|
Hotels |
|
|
|
|
|
|
|
1 |
Ambulance Station Hotel |
1 |
Auburn |
Cumberland |
30 |
$5.4million |
|
2 |
Oasis on Beamish |
2 |
Campsie |
Canterbury-Bankstown |
30 |
$5.2million |
|
3 |
Cross Roads Hotel |
3 |
Casula |
Liverpool |
30 |
$5.1million |
|
Clubs |
|
|
|
|
|
|
|
1 |
Mounties |
1 |
Mount Pritchard |
Fairfield |
603 |
$23million |
|
2 |
Bankstown Sports Club |
2 |
Bankstown |
Canterbury-Bankstown |
745 |
$21million |
|
3 |
Wentworthville Leagues Club |
3 |
Wentworthville |
Cumberland |
545 |
$21million |
1.2. LGA loss data
Now that Liquor and Gaming provide population figures for LGAs, we are calculating the number of people per EGM. The lower the number, the higher the EGM density.
|
Venue type |
Average across NSW LGAs |
|
Hotels |
357 |
|
Clubs |
124 |
|
Both (total population/total EGMs) |
92 |
Estimated annual loss per person:
As a very rough estimate, we divided the loss amount for an LGA (or small bundle) by the LGA population and multiplied by 4. This is an under-estimate, as the losses in Q1 are usually the lowest quarterly losses each year. The resulting figure is for every person in the LGA, adults and children, and so would be considerably higher if only the adult, active gambling population was considered.
Top 10 Metro LGAs for losses:
The only change from Q4 2024 is that Sydney is no longer bundled with Mosman/North Sydney, but the order of LGAs remains the same
|
LGA |
Losses |
Daily losses |
EGMs |
Venues |
ppl/EGM |
Estimated annual loss per person |
|
|
1 |
Canterbury-Bankstown |
$ 186,060,655 |
$ 2,067,341 |
4924 |
61 |
75 |
$2006 |
|
2 |
Fairfield |
$ 169,624,242 |
$ 1,884,714 |
3808 |
37 |
55 |
$3255 |
|
3 |
Cumberland |
$ 128,310,858 |
$ 1,425,676 |
2719 |
32 |
87 |
$2180 |
|
4 |
Sydney |
$ 95,897,232 |
$ 1,065,525 |
3324 |
158 |
64 |
$1813 |
|
5 |
Blacktown |
$ 94,295,370 |
$ 1,047,726 |
2910 |
37 |
136 |
$951 |
|
6 |
Parramatta |
$ 71,374,700 |
$ 793,052 |
1899 |
34 |
135 |
$1112 |
|
7 |
Georges River |
$ 71,018,872 |
$ 789,099 |
2091 |
31 |
73 |
$1866 |
|
8 |
Penrith |
$ 58,189,824 |
$ 646,554 |
2548 |
35 |
85 |
$1069 |
|
9 |
Campbelltown |
$ 56,386,030 |
$ 626,511 |
1854 |
21 |
95 |
$1278 |
|
10 |
Burwood, Strathfield |
$ 53,871,045 |
$ 598,567 |
895 |
19 |
96 |
$2511 |
Top 10 Regional (non-metro) LGAs for losses
Changes in the top 10 ranking LGAs are due to the changes in the way Liquor and Gaming bundle LGAs together if one has fewer than 5 venues of a type. The bundling is not done the same way each quarter and may differ for hotels and clubs. This may give a false impression of increased losses in some areas. Venue by venue data (currently collected by NSW Liquor and Gaming but not released as it is in Victoria) would solve this problem.
|
|
LGA |
Losses |
Daily Losses |
EGMs |
Venues |
Ppl/EGM |
Estimated annual loss per person |
|
1 |
Central Coast |
$ 83,938,461 |
$932,649.57 |
4439 |
65 |
78 |
$969 |
|
2 |
Wollongong |
$ 48,659,175 |
540,657.50 |
2703 |
62 |
79 |
$907 |
|
3 |
Newcastle |
$ 47,537,697 |
$528,196.63 |
2741 |
80 |
62 |
$1126 |
|
4 |
Murray River etc** |
$ 40,142,449 |
$446,027.21 |
2281 |
42 |
n/a |
n/a |
|
5 |
Lake Macquarie |
$ 39,332,765 |
$437,030.72 |
2458 |
59 |
87 |
$736 |
|
6 |
Tweed |
$ 27,749,860 |
$308,331.78 |
1881 |
28 |
52 |
$1140 |
|
7 |
Shoalhaven |
$ 25,263,466 |
$280,705.18 |
1653 |
36 |
66 |
$931 |
|
8 |
Albury (H,C) and Greater Hume ( C)*** |
$ 23,913,507 |
$265,705.63 |
1208 |
19 |
n/a |
n/a |
|
9 |
Armidale Regional etc**** |
$ 22,404,805 |
$248,942.28 |
1479 |
68 |
n/a |
n/a |
|
10 |
Mid-Coast |
$ 22,273,808 |
$247,486.76 |
1372 |
46 |
70 |
$923 |
**Berrigan, Edward River, Federation, Hay, Murray River
*** Greater Hume hotel data is included with Wagga Wagga and associated LGAs
**** Armidale, Bellingen, Glen Innes Severn, Clarence Valley, Kyogle, Inverell, Tenterfield
Breadth of impact of venues prioritising gambling income:
Our data analysis has to date focused on a simple listing of the LGAs with the largest losses. These “Top 10 Metro/Regional” lists do not vary much, apart from idiosyncrasies introduced by changes to bundling by Liquor and Gaming, which appears more concerned with venue privacy than transparency of data for public health policy development. The losses in the LGAs will always be very high, because the total number of machines is so high. It is worth bearing in mind that Tasmania has 2,274 poker machines in total in its pubs and clubs, a figure exceeded by 6 out of 10 top 10 Metropolitan LGAs (each) and the top 5 regional LGAs (each).
These figures show, quarter by quarter, the depth of gambling harm through the proxy of financial losses to individuals and the community.
However, until now, we have not investigated the breadth of gambling harm across the state.
In the absence of venue by venue data, we have turned to ranking of every venue in the state by net profit (to the venue)/net loss (to the community). Although the amount of the loss remains protected by a close reading of the Taxation Administration Act by the Department, the higher the ranking the greater the losses.
By using the ranking spreadsheet, we can also investigate harm in each LGA, as these figures are not bundled as in the net profit spreadsheets.
Our analysis shows that in some LGAs with few venues and low numbers of poker machines; many venues are disproportionately profitable to their owners or managers. Our methodology is this:
- For each quarter, for each LGA, we take the median of the ranks for all the venues
- We then sort the medians to establish the Top 10 list
- We then note in how many quarters an LGA has appeared in the top 10 rankings median list.
To illustrate from Q1 2025, the median depends on the absolute rankings of each venue, and how many venues there are in an LGA. There are around 1000 clubs and 1150 hotels with operating poker machines in NSW, very unevenly distributed.
|
LGA |
Type |
Number of venues |
Top Rank |
Bottom Rank |
Median |
|
Albury |
Clubs |
4 |
34 |
593 |
184 |
|
|
Hotels |
11 |
169 |
1001 |
652 |
|
Armidale Region |
Clubs |
4 |
185 |
928 |
341 |
|
|
Hotels |
8 |
576 |
1136 |
759 |
|
Bayside |
Clubs |
18 |
42 |
877 |
511 |
|
|
Hotels |
15 |
44 |
1054 |
138 |
|
Burwood |
Clubs |
5 |
20 |
371 |
130 |
|
|
Hotels |
7 |
17 |
563 |
43 |
|
Fairfield |
Clubs |
18 |
1 |
987 |
90 |
|
|
Hotels |
19 |
9 |
549 |
56 |
|
Shellharbour |
Clubs |
6 |
47 |
384 |
257 |
|
|
Hotels |
9 |
276 |
862 |
467 |
The resulting lists of LGAs which have venues ranking highly enough to reach the top 10 list each quarter (over the 25 quarters for which we have data) include LGAs normally not discussed in terms of gambling harm. Figure 2 (HOTELS), for instance, has Burwood LGA at the head of the harm list, meaning Burwood’s median hotel losses ranking occurred in the top 10 in the state in 24 of the 25 quarters for which data is available. LGAs appearing in this new analysis which have never appeared on the net loss top 10 Metro/Regional lists include The Hills, Ryde, Griffith, Leeton and Wagga Wagga (for hotels) and Shellharbour (high median club rankings for 23 of 25 quarters), Murray River, Balranald and Singleton (for clubs).
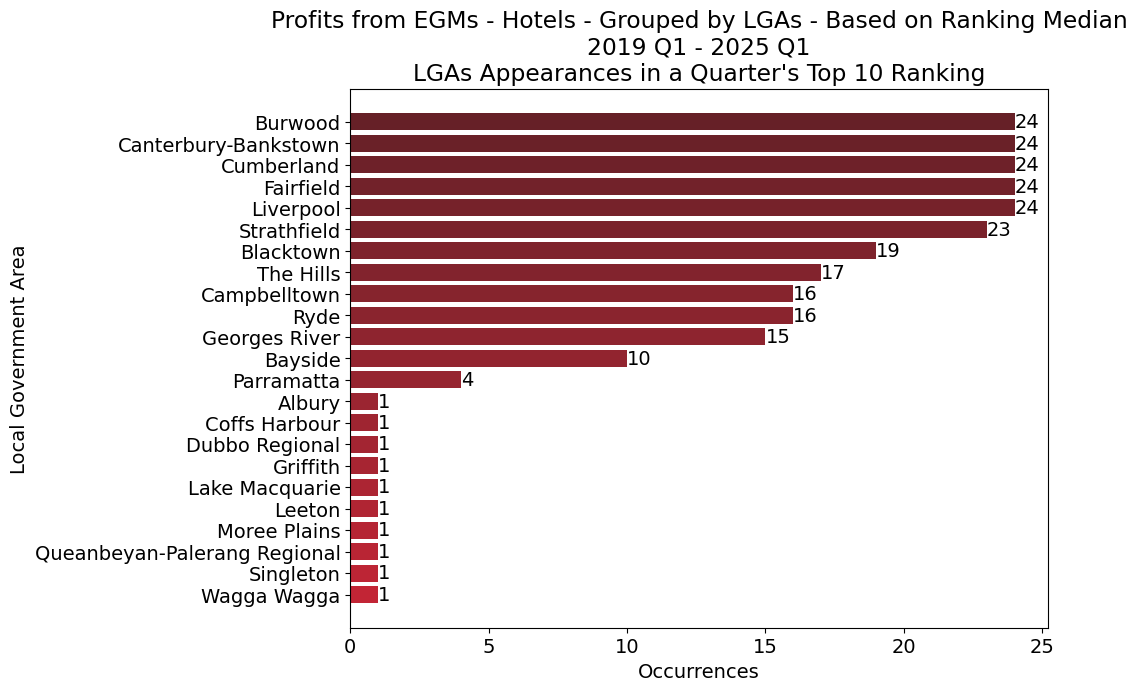
Figure 2: Analysis - Maleakhi Faith for Wesley Mission
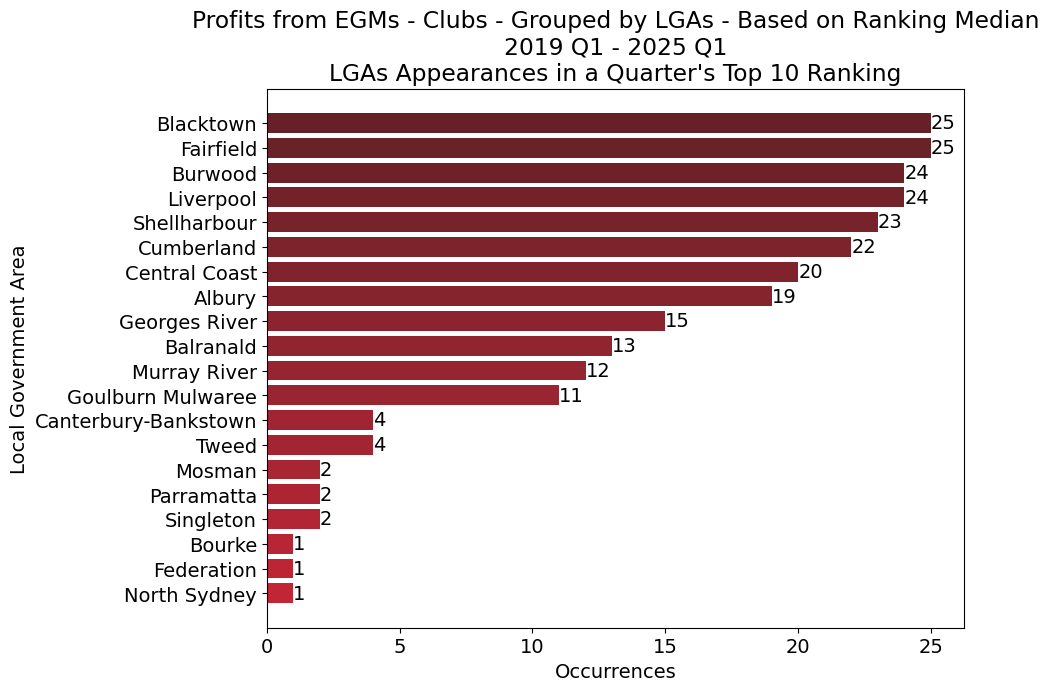
Figure 3: Analysis by Maleakhi Faith for Wesley Mission
Our interpretation of these results is that any LGA which has median rankings occurring in the top 10 for at least one quarter is experiencing losses through poker machines significantly in excess of average amounts. It may be a single very highly ranked venue in an LGA with few venues, or there may be several venues ranked highly.
Either way, it raises the question of whether venues in those LGAs are operating as hotels or clubs, or as casinos.
[1] Reduced losses due to Covid-19 lockdowns, which differ due to the one month difference between club and hotel reporting quarters
⸻